Central Business District
The Central Business District (CBD) is bordered by Colfax Ave to the south, Speer to the west, Lawrence St to the Northwest, 20th St to the Northeast, and Broadway to the East.
 Central Business District Demographics
4,631
Total Population
Denver Population: 706,799
33.5
Median Resident Age
Denver Median Resident Age: 35.5
$55,950
Median Income Per Resident
Denver Median Income Per Resident: $53,437
$95,973
Median Income Per Household
Denver Median Income Per Household: $85,721
$1,125
Median Rent
Denver Median Rent: $1,143
$533,235
Median Home Value
Denver Median Home Value: $513,621
21.4%
% homes owner occupied (vs. renter)
Denver % of homes owner occupied (vs. renter): 46.4%
80%
% homes occupied (vs. vacant)
Denver % home occupied (vs. vacant): 94%
 Public Safety
Denver Police District 6
Address: 1566 N Washington St.
Phone: 720-913-2800
Technician
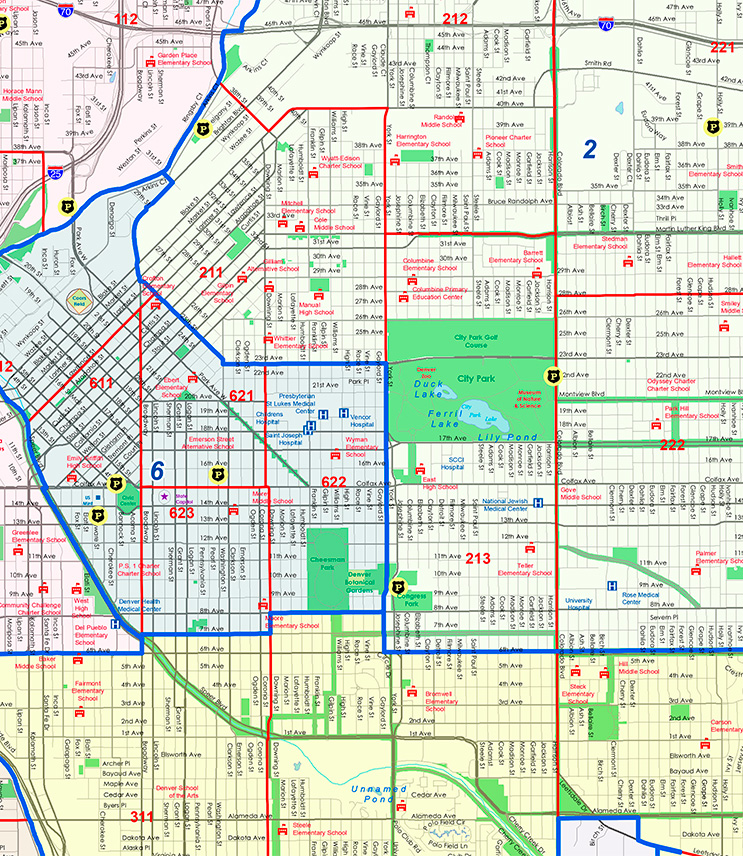
Denver Police Districts Map
The map above shows the outline of Police Districts 2 & 6 within the boundaries of Denver District 10.
Central Business District – Year Home Was Built
Data for Year Home Was Built-Central Business District Compared to Denver
| Year Home Was Built | Central Business District | Denver |
|---|---|---|
| Before 1939 | 21% | 18% |
| 1940 – 1949 | 0% | 6% |
| 1950 – 1959 | 2% | 14% |
| 1060 – 1969 | 21% | 11% |
| 1970 – 1979 | 11% | 13% |
| 1980 – 1989 | 17% | 8% |
| 1990 – 1999 | 4% | 7% |
| 2000 – 2009 | 15% | 11% |
| 2010 – 2013 | 11% | 13% |
| After 2013 | 0% | 0.3% |
Central Business District – Resident Ethnicity
Data for Resident Ethnicity-Central Business District Compared to Denver
| Resident Ethnicity | Central Business District | Denver |
|---|---|---|
| White | 70.3% | 57.5% |
| Hispanic | 12.3% | 27.4% |
| Black | 6.9% | 7.5% |
| Asian | 2.8% | 3.1% |
| Other | 0.5% | 0.3% |
| Two or more | 7.3% | 3.7% |
Central Business District – Resident Education Level
Data for Resident Education Level-Central Business District Compared to Denver
| Education Level | Central Business District | Denver |
|---|---|---|
| Bachelor or higher | 69% | 53% |
| Some college | 21% | 22% |
| HS grad or Equiv | 6% | 16% |
| Less than HS | 4% | 10% |
Central Business District – Resident Age
Data for Resident Age-Central Business District Compared to Denver
| Age | Central Business District | Denver |
|---|---|---|
| 0 to 9 | 0.3% | 11% |
| 10 – 19 | 8.5% | 10% |
| 20 – 29 | 32.8% | 18% |
| 30 – 39 | 21.9% | 21% |
| 40 – 49 | 14.3% | 14% |
| 50 – 59 | 11.3% | 10% |
| 60 – 69 | 6.7% | 9% |
| 70 – 79 | 4% | 5% |
| 80+ | 0.4% | 3% |
 Central Business District History
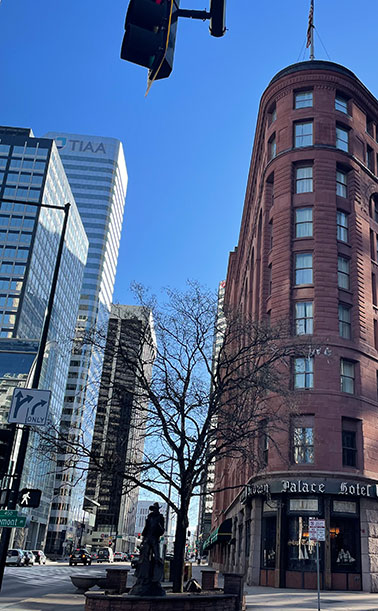
The development of street railways helped facilitate the growth of Denver’s commercial district. In 1874, tracks were installed down 16th Street to Broadway. The system was expanded in the 1880s with lines linking the city center with outlying residential areas. In 1880 the Denver City Cable Railway Company created what has been described as the largest single cable powerhouse in the world, the Denver City Cable Railway Building at 18th and Lawrence streets. New millionaires created by the riches of mining came to Denver seeking projects in which to invest funds and influence the development of buildings like the Brown Palace and the Dry Goods Building.
By 1880, Denver’s population surged to 35,629, a 648.7 percent increase in only ten years. During the next decade, the city’s population nearly tripled. With 106,713 residents in 1890, Denver was the second largest urban center in the West. As railroad access made the shipment of construction materials easier and less expensive, Denver buildings began to reflect the wide variety of products available.
By the beginning of the twentieth century, 16th Street was known as the “city promenade” and was compared to Chicago’s State Street. Jerome Smiley asserted that “it is doubtful if there is in any city of corresponding size in this country a shopping thoroughfare more attractive, more animated, or thronged by greater numbers of people.” The major retail stores along 16th Street were architecturally significant and designed by a variety of prominent local architects.
Following WWII, many servicemen who had been stationed at local military posts returned to Denver to live, stimulating a sustained period of growth and prosperity. Writing in 1949, Charles Graham and Robert Perkin described Denver as the “reluctant capital” of the Rocky Mountain West: “Colorado’s cowtown is the agricultural, mining, livestock, and manufacturing capital of a vast region. Even more dominantly, and certainly more self-consciously, it is the commerce capital of the region.”
In the mid-1960s the successful preservation and redevelopment of Larimer Street, which had once been the heart of the city’s business district, demonstrated that restoration of historic buildings was an economically viable alternative to demolition. During the same period, the Skyline Urban Renewal Project formulated plans to demolish a large section of historic commercial buildings in an area between Speer Boulevard, 20th Street, Curtis Street, and the alley between Larimer and Market streets. Voter approval for the Skyline Project came in 1967, as did the Denver City Council’s approval of a Historic Preservation Ordinance and creation of a Landmark Preservation Commission. Historic Denver, Inc., a private, non-profit organization advocating preservation, was founded three years later.
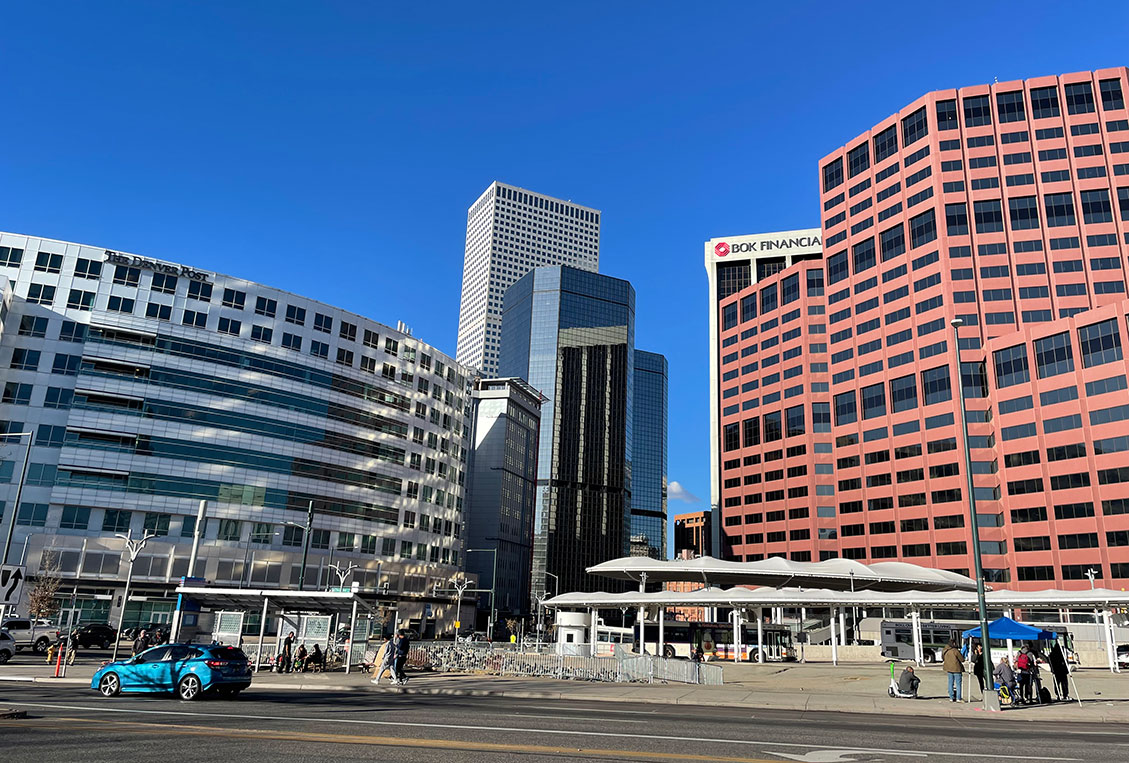
Today, Downtown acts as a main economic engine for the city, and is the host to restaurants, boutiques, bars, and other businesses.
Read more about Central Business District history
The city of Denver was founded at the confluence of the South Platte River and Cherry Creek in November 1858 after a small amount of gold was discovered there. Prior to that time, the area had been inhabited by the Cheyenne and Arapaho, who had legal title to the land through the signing of the Treaty of Fort Laramie in 1851. Legal possession of the region, including the area that would become Denver, passed to the United States in 1861 with the Treaty of Fort Wise, which to this day is contested.

